Autocorrelation for temporal data
stat_acf.RdSince the data input is data.frame, it's better to sort the date-times
from early to recent and make implicit missing values explicit before using
stat_acf.
stat_acf(
  mapping = NULL,
  data = NULL,
  geom = "bar",
  position = "identity",
  na.rm = FALSE,
  show.legend = NA,
  inherit.aes = TRUE,
  lag.max = NULL,
  type = "correlation",
  level = 0.95,
  ...
)
Arguments
| mapping | Set of aesthetic mappings created by |
|---|---|
| data | The data to be displayed in this layer. There are three options: If A A |
| geom | The geometric object to use display the data |
| position | Position adjustment, either as a string, or the result of a call to a position adjustment function. |
| na.rm | Logical. If |
| show.legend | logical. Should this layer be included in the legends?
|
| inherit.aes | If |
| lag.max | An integer indicating the maximum lag at which to calculate the acf. |
| type | A character string giving the type of the acf to be computed. The default is the "correlation" and other options are "covariance" and "partial". |
| level | A numeric defining the confidence level. If |
| ... | Other arguments passed on to |
Examples
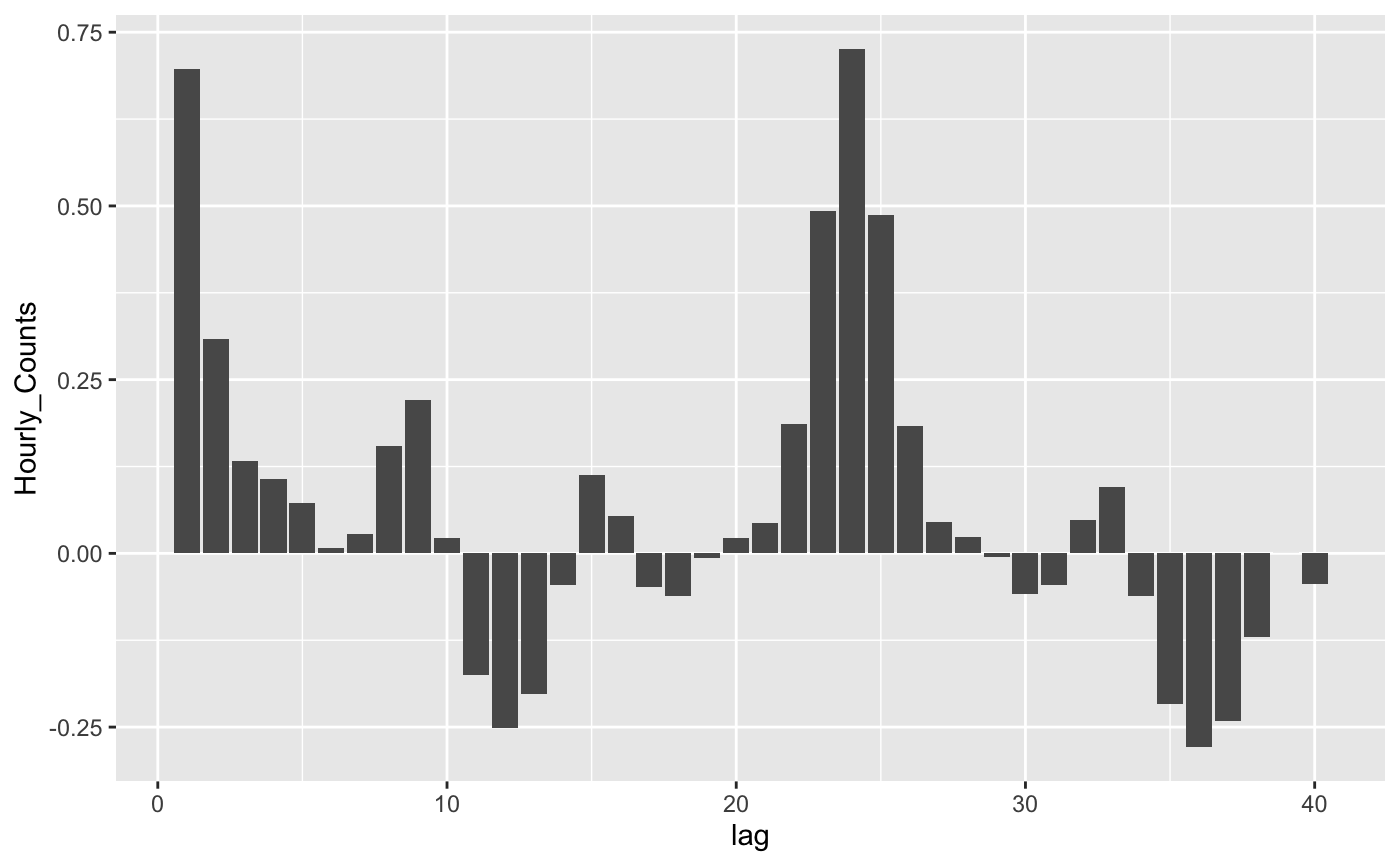
library(dplyr)
fstaff <- hourly_peds %>%
  filter(Sensor_ID == 13)

# use ggplot2
fstaff %>%
  ggplot(aes(x = ..lag.., y = Hourly_Counts)) +
  stat_acf(geom = "bar")