The goal of rwalkr is to provide APIs to the pedestrian and microclimate data from the City of Melbourne in tidy data form.
Installation
You could install the stable version from CRAN:
install.packages("rwalkr")You could install the development version from Github using:
# install.packages("devtools")
devtools::install_github("earowang/rwalkr")
Usage
APIs
There are two APIs available to access hourly Melbourne pedestrian data: compedapi and Socrata. The former drives the melb_walk() function, where counts are uploaded on a daily basis; the latter powers the melb_walk_fast() function, where counts are uploaded on a monthly basis. Given the function names, the function melb_walk_fast() pulls the data at a much faster speed than melb_walk().
The function melb_walk() specifies the starting and ending dates to be pulled, whereas melb_walk_fast() requires years to define the time frame. If a selection of sensors are of interest, melb_walk_fast() provides the flexibility for sensor choices.
library(rwalkr)
start_date <- as.Date("2017-07-01")
ped_walk <- melb_walk(from = start_date, to = start_date + 6L)
ped_walk
#> # A tibble: 10,584 x 5
#>   Sensor                     Date_Time           Date        Time Count
#>   <chr>                      <dttm>              <date>     <int> <int>
#> 1 Bourke Street Mall (North) 2017-07-01 00:00:00 2017-07-01     0   280
#> 2 Bourke Street Mall (South) 2017-07-01 00:00:00 2017-07-01     0   177
#> 3 Melbourne Central          2017-07-01 00:00:00 2017-07-01     0   826
#> 4 Town Hall (West)           2017-07-01 00:00:00 2017-07-01     0   682
#> 5 Princes Bridge             2017-07-01 00:00:00 2017-07-01     0     0
#> # … with 10,579 more rows
ped_run <- melb_walk_fast(year = 2016:2017, sensor = NULL) # NULL means all sensors
ped_run
#> # A tibble: 912,288 x 5
#>   Sensor                      Date_Time           Date        Time Count
#>   <chr>                       <dttm>              <date>     <int> <int>
#> 1 Alfred Place                2016-01-01 00:00:00 2016-01-01     0    NA
#> 2 Birrarung Marr              2016-01-01 00:00:00 2016-01-01     0  1405
#> 3 Bourke St-Russell St (West) 2016-01-01 00:00:00 2016-01-01     0  1900
#> 4 Bourke Street Mall (North)  2016-01-01 00:00:00 2016-01-01     0   461
#> 5 Bourke Street Mall (South)  2016-01-01 00:00:00 2016-01-01     0   883
#> # … with 912,283 more rows
There are missing values (i.e. NA) in the dataset. By setting na.rm = TRUE in both functions, missing values will be removed.
Here’s an example to use ggplot2 for visualisation:
library(ggplot2)
ggplot(data = subset(ped_walk, Sensor == "Melbourne Central")) +
  geom_line(aes(x = Date_Time, y = Count))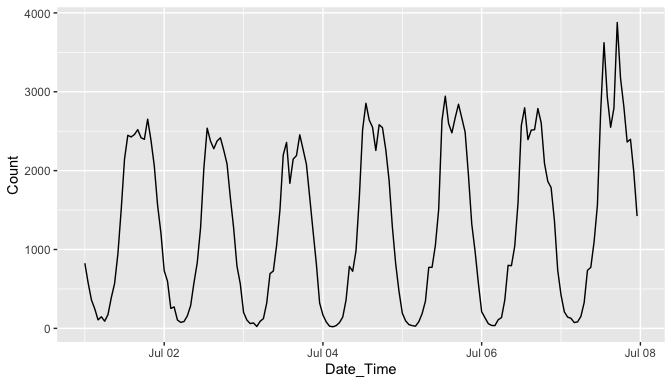
To access minute by minute directional pedestrian counts for the last hour, please check out the melb_walk_directional().
It’s recommended to include an application token in melb_walk_fast(app_token = "YOUR-APP-TOKEN"), which you can sign up here.
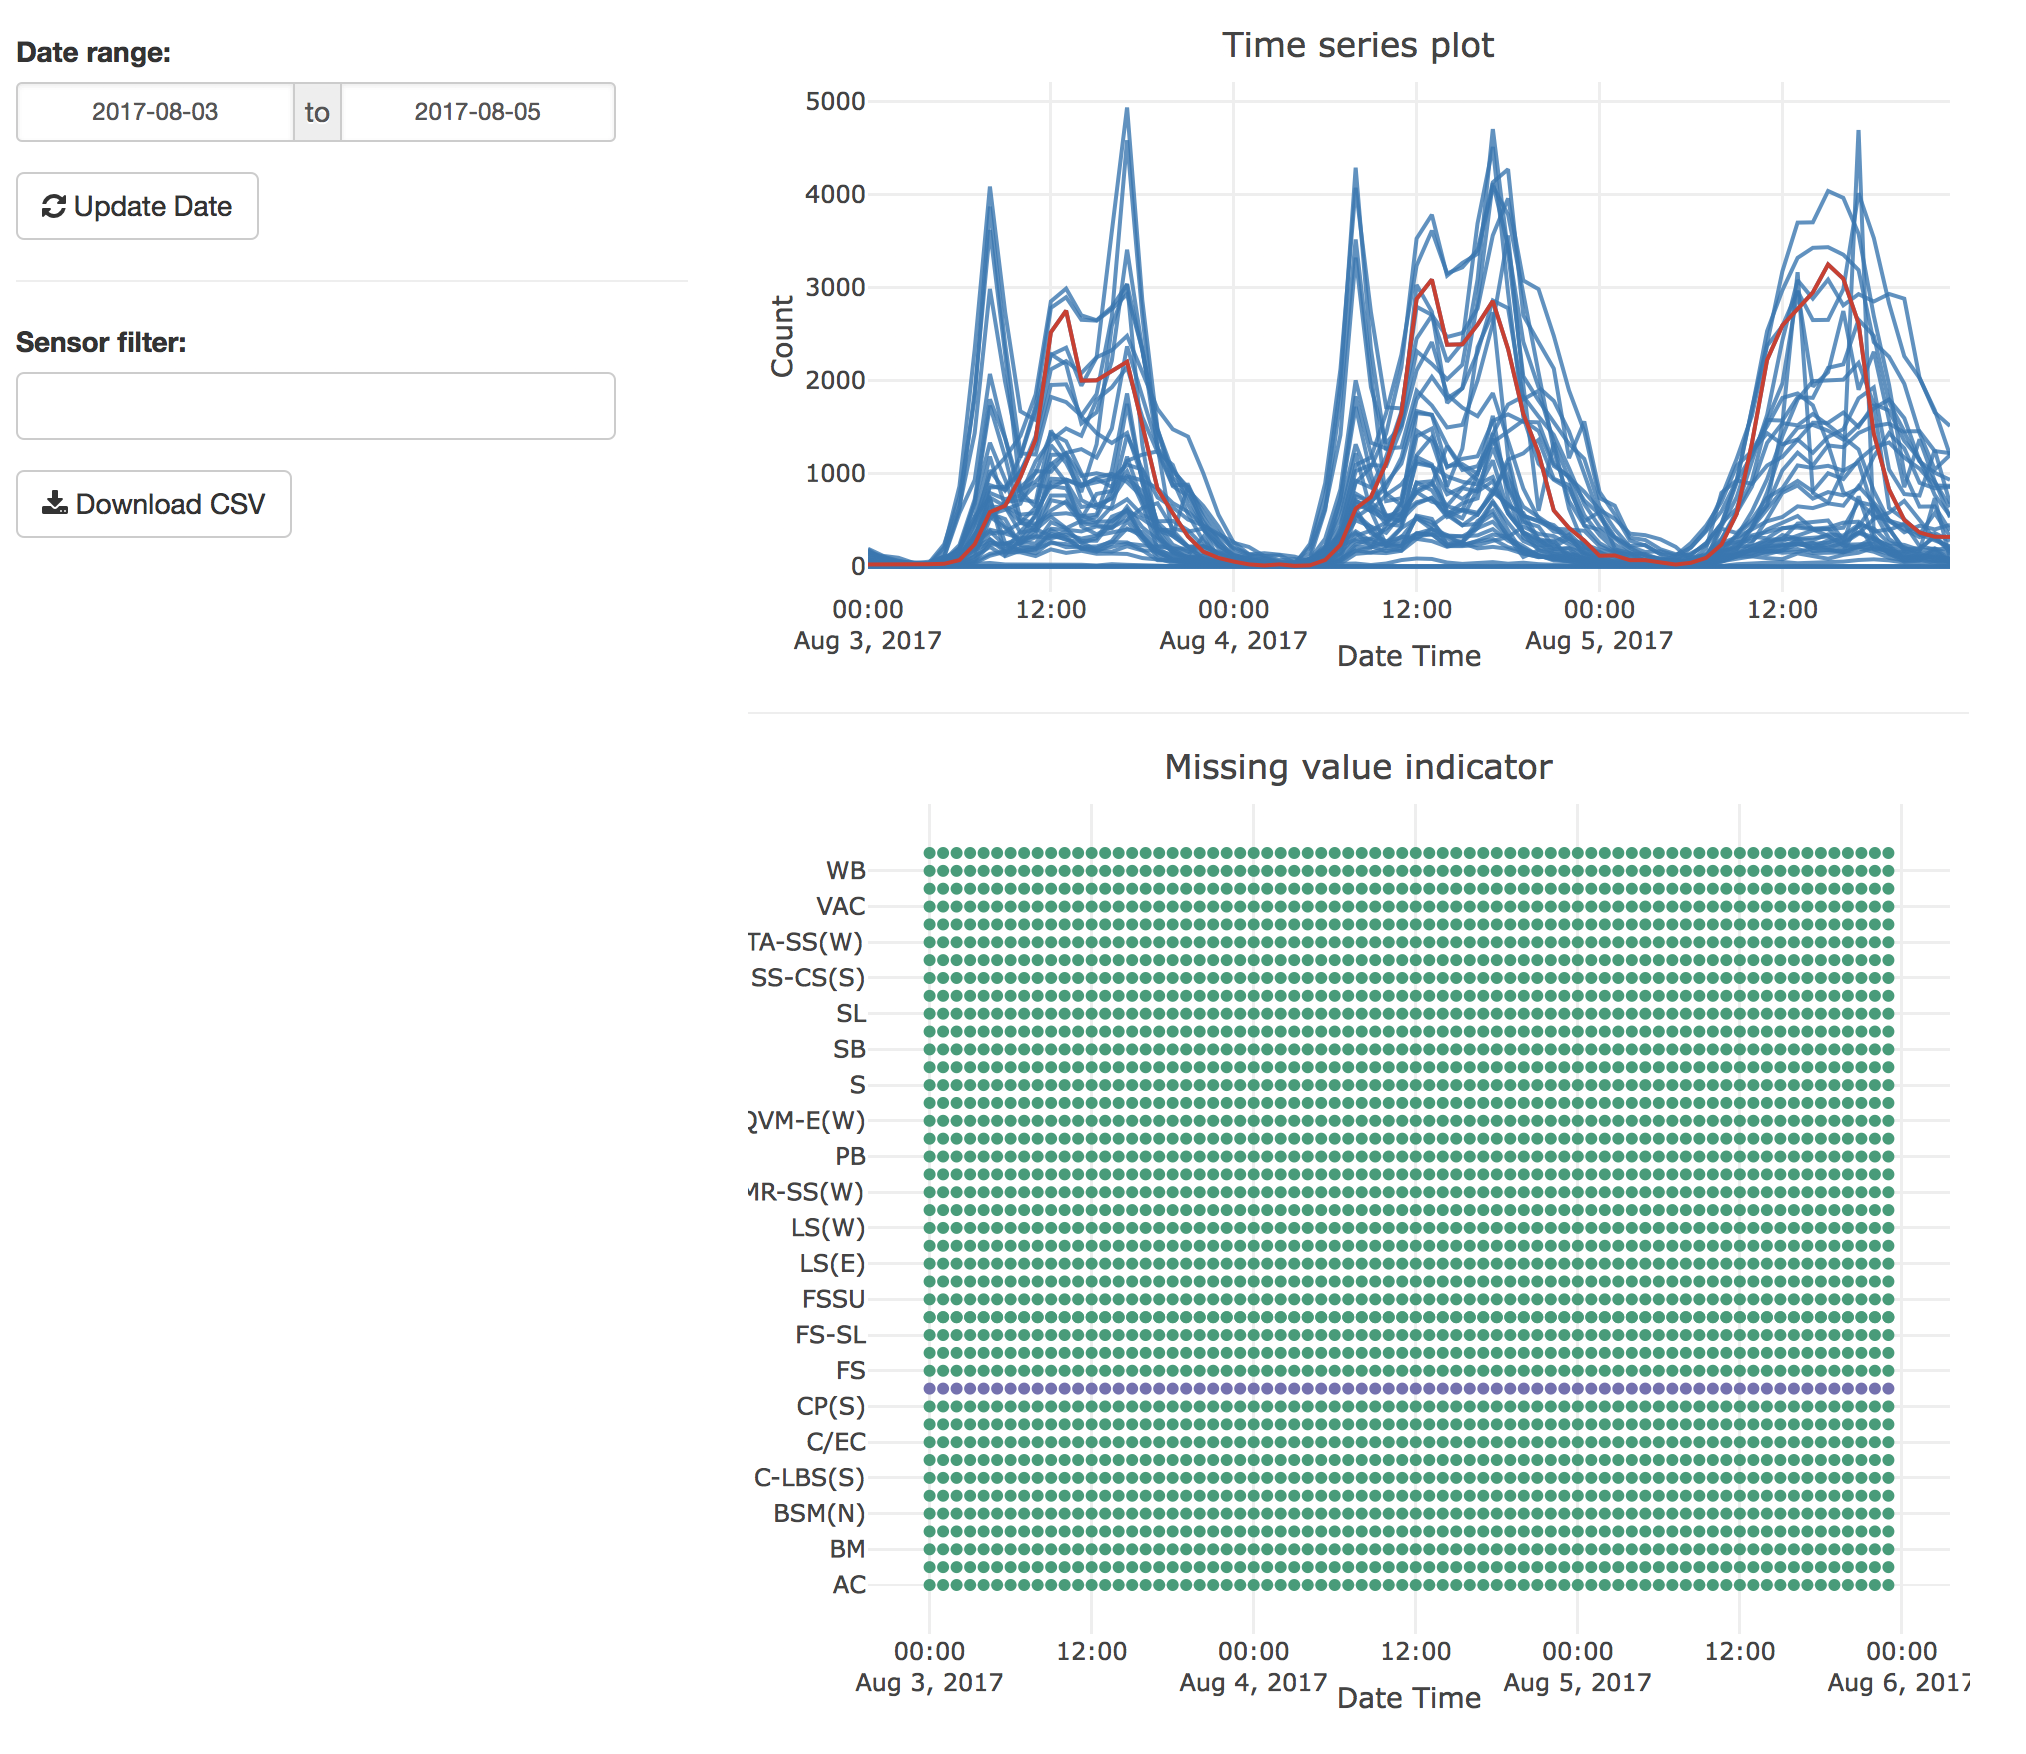
Shiny app
The function melb_shine() launches a shiny app to give a glimpse of the data. It provides two basic plots: one is an overlaying time series plot, and the other is a dot plot indicating missing values. Below is a screen-shot of the shiny app.